

6 NOVEMBER 2026 · HAZEM 15M · SIGNAL LIFECYCLE
From Entry Activation to TP2: Inside the CyGuru Gold Terminal
A direction is only the beginning of a signal. The more useful question is what happened after it arrived. A fresh Hazem SELL record shows why the CyGuru Gold Terminal brings activation, target progress and unresolved outcomes into the same view.

Explore the CyGuru Gold Terminal →
A specific record, not a general success claim
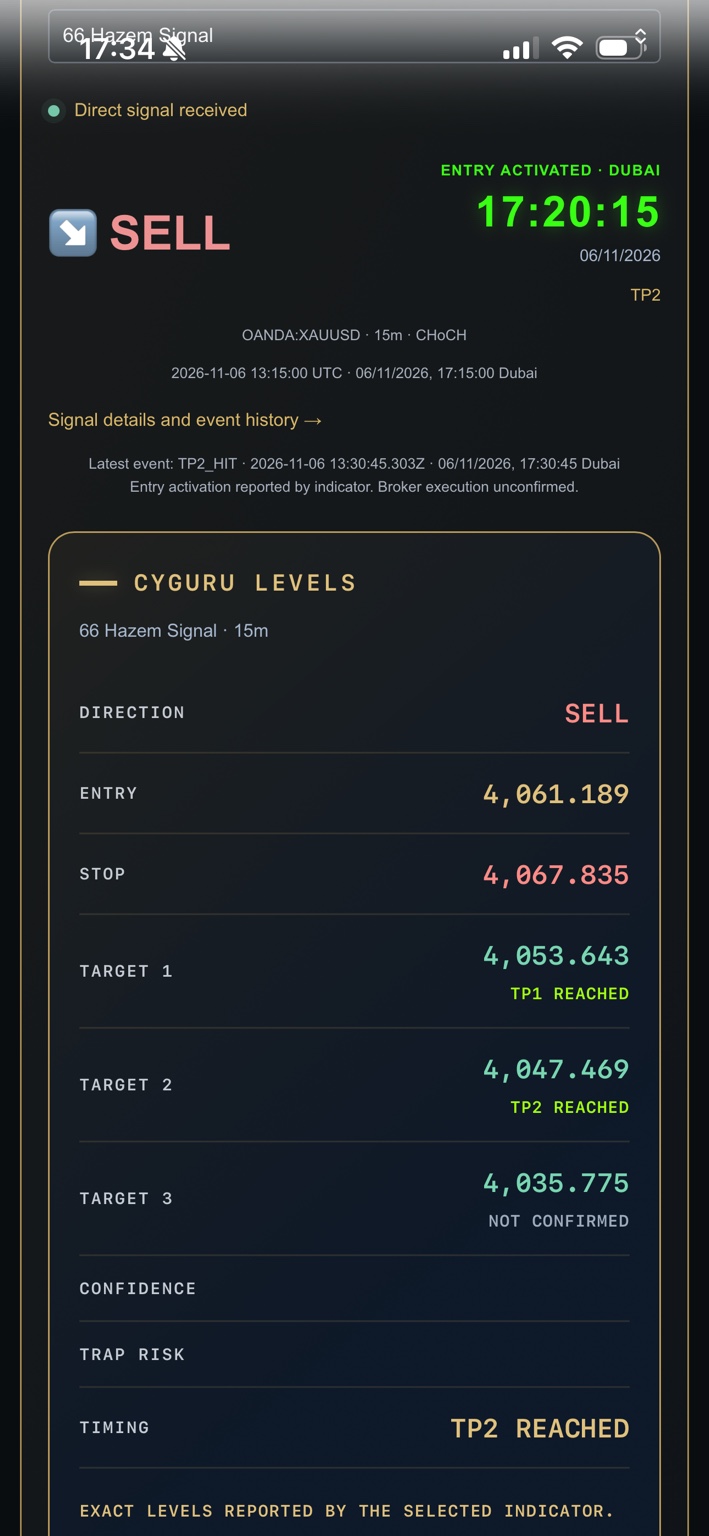
On 6 November 2026, the terminal displayed a 66 Hazem Signal SELL on OANDA:XAUUSD, using the 15-minute timeframe and the setup label CHoCH. The signal was timestamped 13:15 UTC, or 17:15 Dubai. Its reference entry was 4,061.189, with a stop at 4,067.835 and three target levels.
The supplied screenshot shows TP1 and TP2 marked REACHED, while TP3 remains NOT CONFIRMED. I also checked the matching public signal record at 13:38:16 UTC / 17:38:16 Dubai. Its identifier ends in 1793970900000; the symbol, timeframe, direction and all five price levels match the capture. At that check, the stored status was TP2 and the highest reported target was 2.
This is a selected favorable case. It is useful because its reporting sequence can be examined, not because one example establishes how the system performs across every market condition.
Three timestamps explain the progression
| Milestone | UTC | Dubai |
|---|---|---|
| Signal created | 13:15:00.000 | 17:15:00.000 |
| Entry activation reported | 13:20:15.272 | 17:20:15.272 |
| TP2_HIT reported | 13:30:45.303 | 17:30:45.303 |
The activation report followed creation by approximately five minutes and fifteen seconds. The TP2 event followed the activation report by approximately ten minutes and thirty seconds. These are intervals between reported indicator events, not measurements of a trader’s execution speed or holding period.
There is an important detail beneath the interface: the preserved record contains three events, with no separate TP1_HIT event. The terminal displays TP1 as reached alongside the higher TP2 milestone. We can therefore document the displayed TP1 status and the recorded TP2 event, but cannot assign an independently recorded TP1 hit time. Keeping that distinction visible makes the case more useful for research.
The exact reference levels
| Field | Price | What is established |
|---|---|---|
| SELL entry | 4,061.189 | Indicator activation reported |
| Stop | 4,067.835 | Reference stop level |
| TP1 | 4,053.643 | REACHED in the terminal; no separate timestamp in the preserved record |
| TP2 | 4,047.469 | TP2_HIT recorded |
| TP3 | 4,035.775 | NOT CONFIRMED |
The entry-to-stop distance is 6.646. The entry-to-TP2 distance is 13.720, approximately 2.064 times the reference stop distance. That is arithmetic describing the planned levels. It is not a realized account return: position size, spread, slippage, commissions, partial exits and actual broker fills are not established here.
The feed’s SUCCESS classification describes its indicator evaluation. It does not convert this record into an audited profitable trade. The screenshot itself states that entry activation was reported by the indicator and broker execution remains unconfirmed. No TP3 outcome is claimed at this cutoff, and a later live update would need separate dated evidence.
Why this matters for the public terminal
My purpose with cyguru.gold/terminal is to make the life of a signal readable. A visitor should be able to distinguish a newly received setup from an activation report, and a reported target from a target that is still unresolved. A bright label becomes meaningful when the underlying record, price levels and timestamps are available beside it.
This case illustrates that design in practical terms. The Dubai activation clock makes the relevant event time prominent. The direction, setup and timeframe identify what is being followed. Separate target labels show progress without implying that every objective has already been met. The event-history link gives the reader a route beyond the headline status.
That is the innovation I want the terminal to deliver: accessible, inspectable signal reporting in a public gold workspace. It is a product and research ambition, not a claim of guaranteed trading advantage. The strongest reason to visit is the ability to examine the process, including what the system has not confirmed.
Read the panel as evidence, not as a promise
Start by matching the indicator, timeframe and signal timestamp. Then read the activation state and latest event before looking at the targets. A familiar indicator name alone is insufficient: a new 15-minute setup is a different record from an earlier five-minute setup, even when both point in the same direction.
Finally, keep the live view and this article separate. The terminal can receive further updates; the article preserves one dated observation. Confidence and trap-risk figures were not supplied in this capture, so this study does not invent them. Nor does it attribute the move to a news release or reconstruct a candle-by-candle price path from an interface screenshot.
Inspect the original evidence
Read the preserved matching signal record → · Inspect the current public feed →
From a selected example to a stronger research process
A credible evaluation needs the whole sample: favorable outcomes, losses, expirations and unresolved records under consistent rules. This selected example cannot establish a win rate, expected return or future reliability. The screenshot and endpoint also belong to the same reporting system; their agreement helps identify the record but is not independent execution verification.
The next useful question is whether that reporting remains complete and understandable across all outcomes. Our Research Lab methodology sets out the evidence distinctions. The earlier 5 November Hazem case is a separate record, not another stage of this signal.
Open the workspace and examine the process
Visit the CyGuru Gold Terminal to explore current reported signals and their levels. Continue with Gold Intelligence for broader analysis, the educational guides for foundational concepts, and the CyGuru trading books for the wider framework. New publications are available through Follow CyGuru Gold.
Source and disclosure notes
Primary sources: the owner-supplied screenshot received on 6 November 2026 and the matching CYGURU.GOLD public gateway record, checked at 13:38:16.719 UTC / 17:38:16.719 Dubai. The preserved JSON retains the source time and record. Calculations use the displayed reference levels. The author develops and promotes CyGuru Gold. This article documents indicator reporting; it does not establish broker execution or offer a current trading instruction.